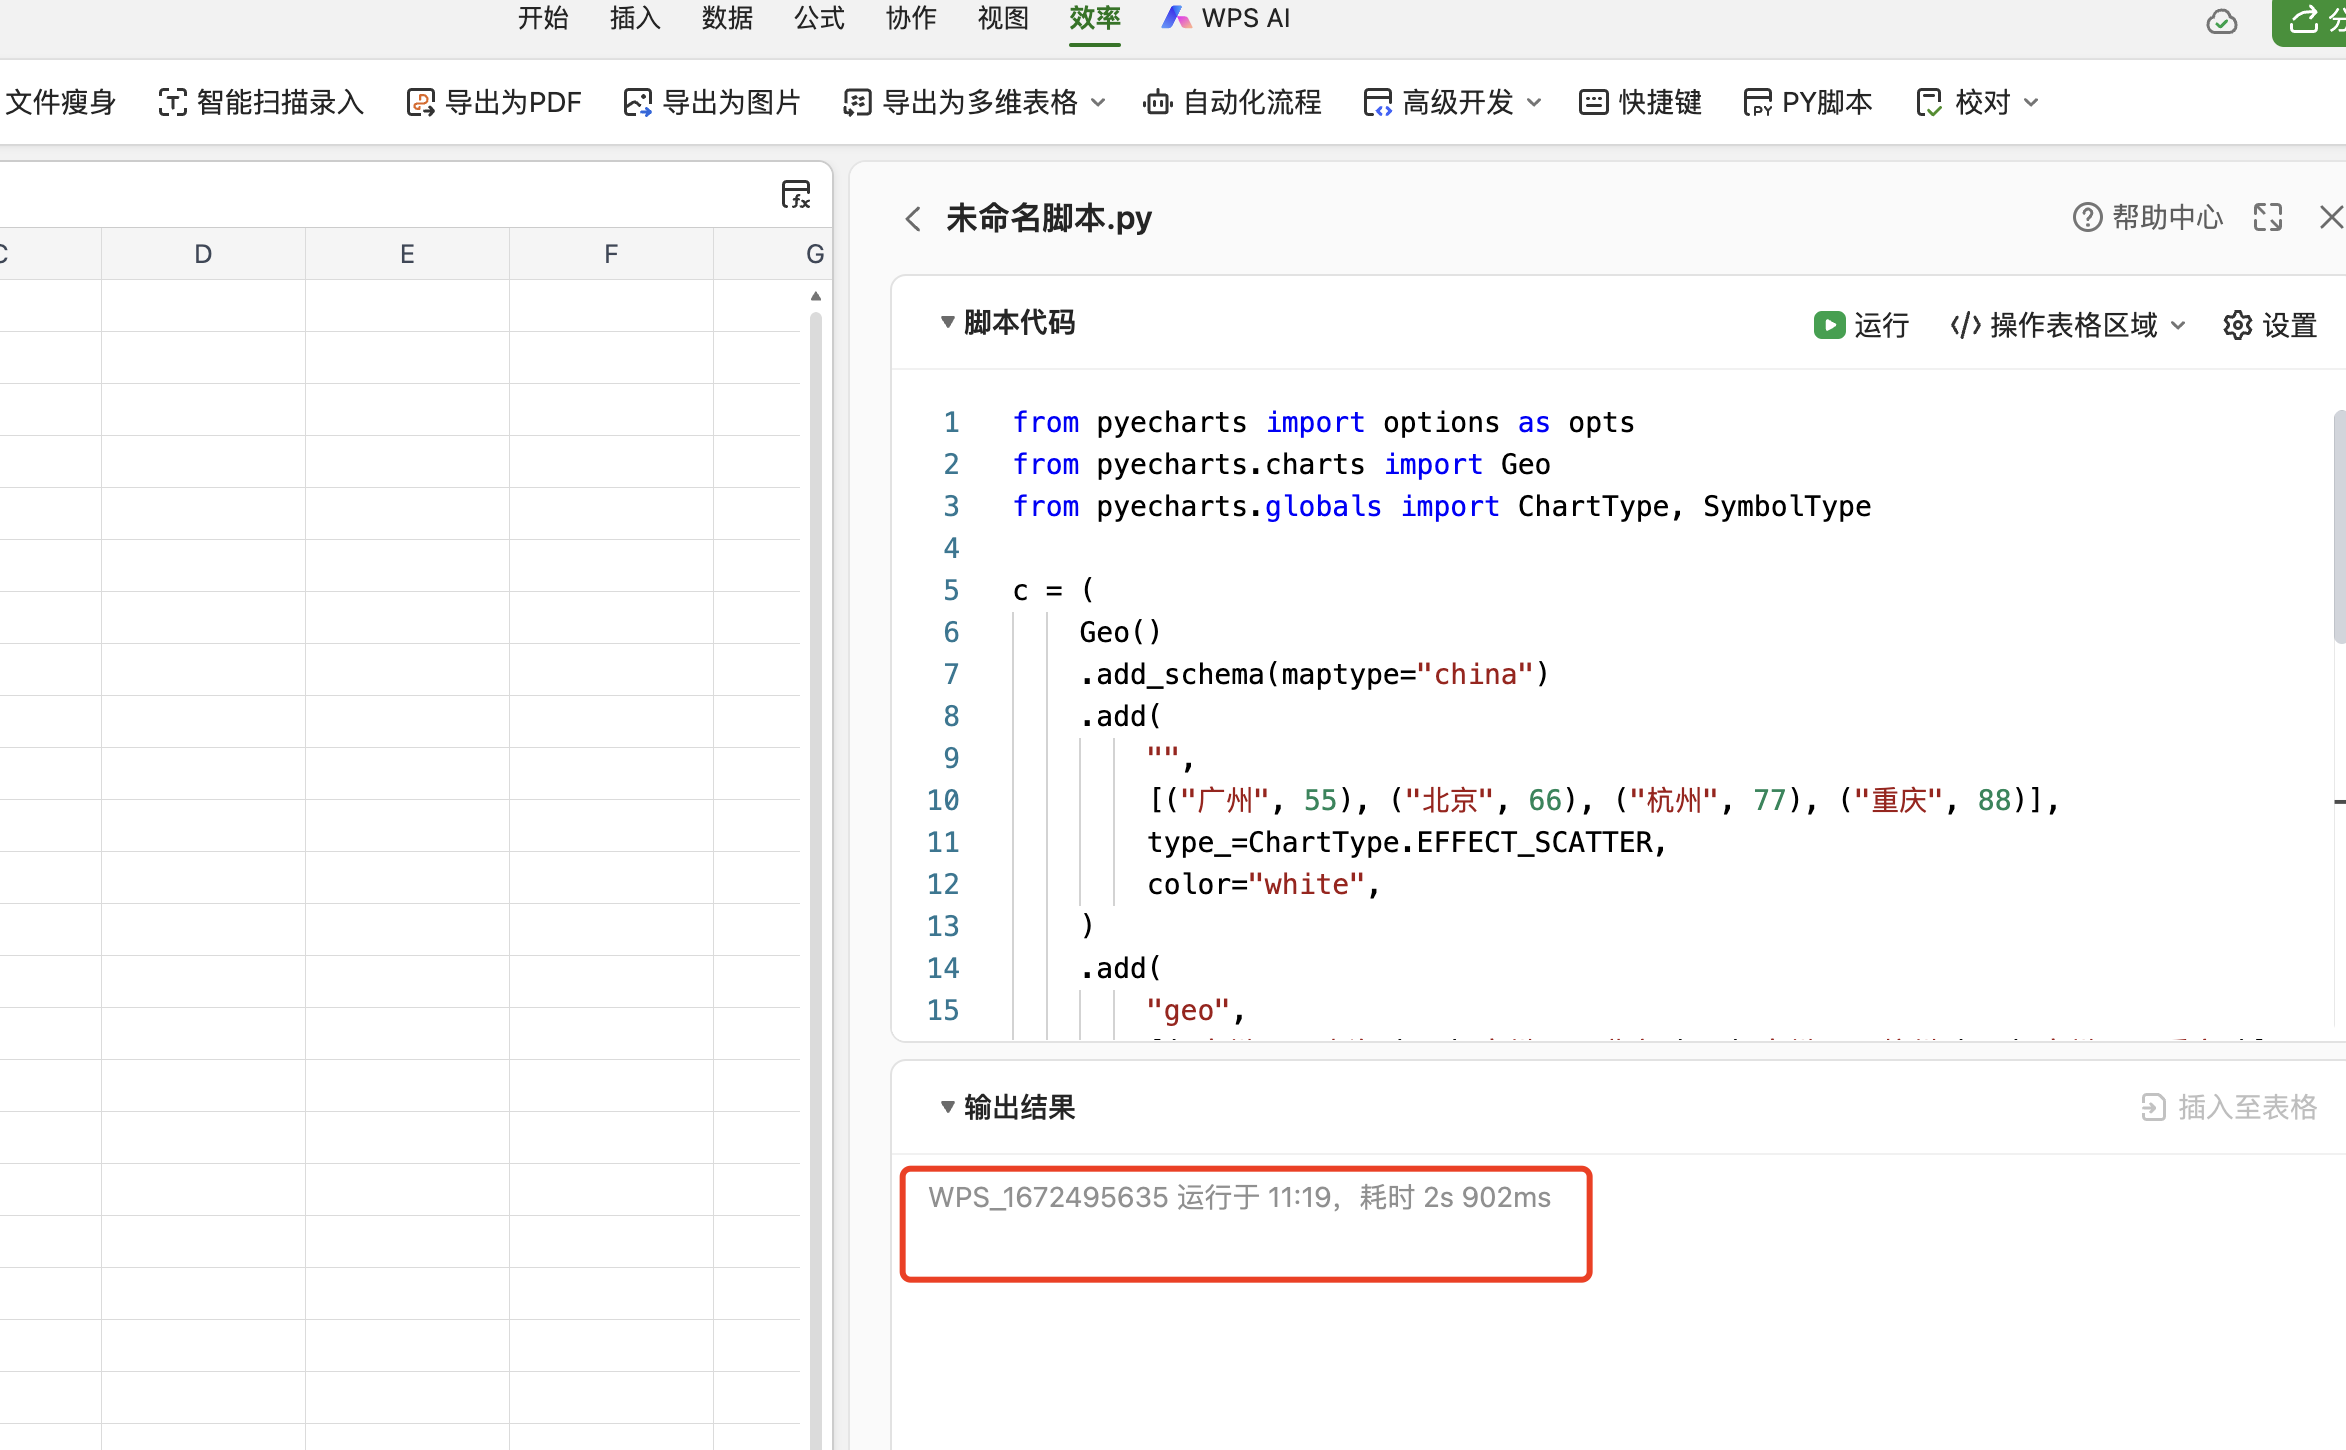
wps 智能表格中 py脚本 运行 pyecharts 中的图标不显示的
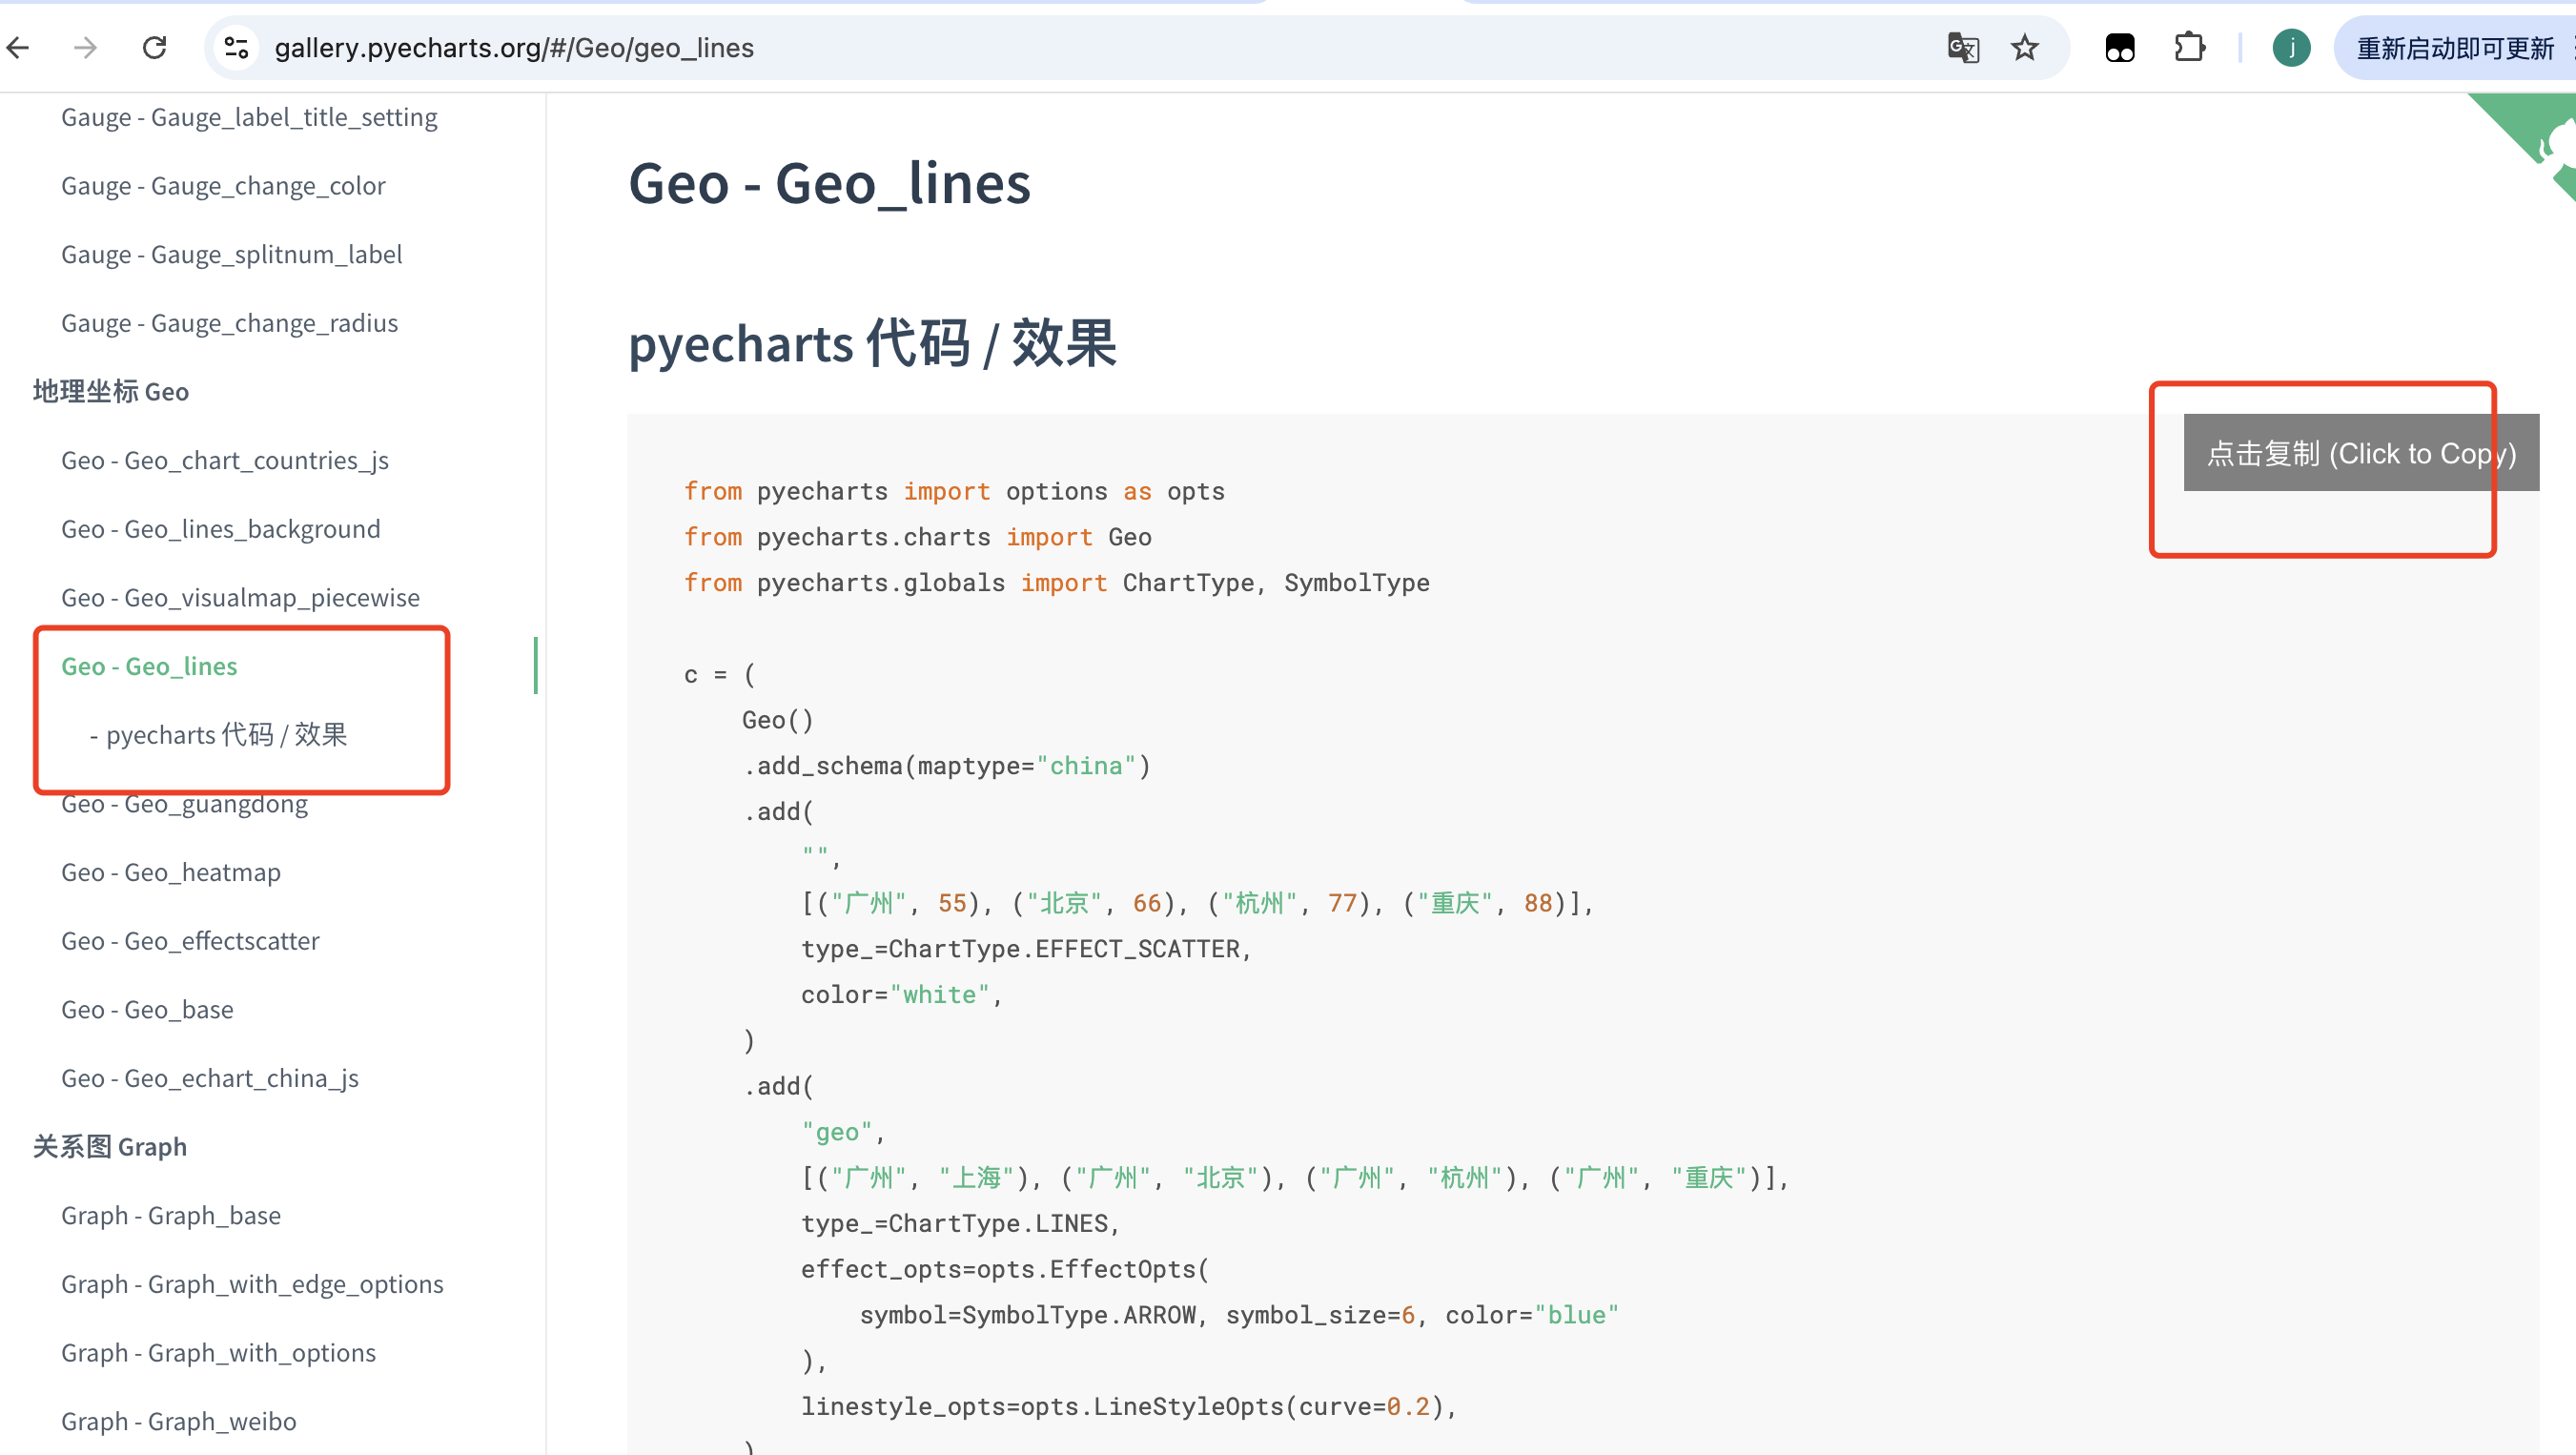
使用的这个网站的的这个脚本 pyecharts 中复制在你 wps 智能表格中 py脚本 运行 pyecharts 中的图标不显示的,请协助解决一下
脚本:
from pyecharts import options as opts
from pyecharts.charts import Geo
from pyecharts.globals import ChartType, SymbolType
c = (
Geo()
.add_schema(maptype="china")
.add(
"",
[("广州", 55), ("北京", 66), ("杭州", 77), ("重庆", 88)],
type_=ChartType.EFFECT_SCATTER,
color="white",
)
.add(
"geo",
[("广州", "上海"), ("广州", "北京"), ("广州", "杭州"), ("广州", "重庆")],
type_=ChartType.LINES,
effect_opts=opts.EffectOpts(
symbol=SymbolType.ARROW, symbol_size=6, color="blue"
),
linestyle_opts=opts.LineStyleOpts(curve=0.2),
)
.set_series_opts(label_opts=opts.LabelOpts(is_show=False))
.set_global_opts(title_opts=opts.TitleOpts(title="Geo-Lines"))
.render()
)
显示如图: